

Create Your Own Powerful Indicator
Custom Indicator
Track & Analyze all your data in one place
Clearedgein.com specializes in creating custom-built TradingView indicators that empower traders with a smarter edge. Our solutions are powerful, optimized, and tailored to match each trader’s unique style.
Alongside custom development, we also offer a lineup of ready-to-use, prebuilt indicators—refined, tested, and crafted to deliver magical precision in trade analysis.
Algorithmic Software Development for Stock Market Edge Tools , Next-Gen Stock Market Tools , Clear the view & find your edge in trading – Unlock powerful stock trading indicators, spot institutional activity, and gain the clarity you need to trade smarter, faster, and with confidence. Advanced stock indicators, institutional activity detection, and precision tools designed to cut through market noise and give traders the ultimate edge.


Magical Trade Indicators
Fine Tune Your Data Reading Ability
All-in-One Data Table – Simplified & Customizable
Get every piece of critical market data in one unified, customizable table. No switching between multiple tools—everything you need is right in front of you. All displayed together in a single, easy-to-use window—fully customizable to match your trading style.


Here’s the hidden data
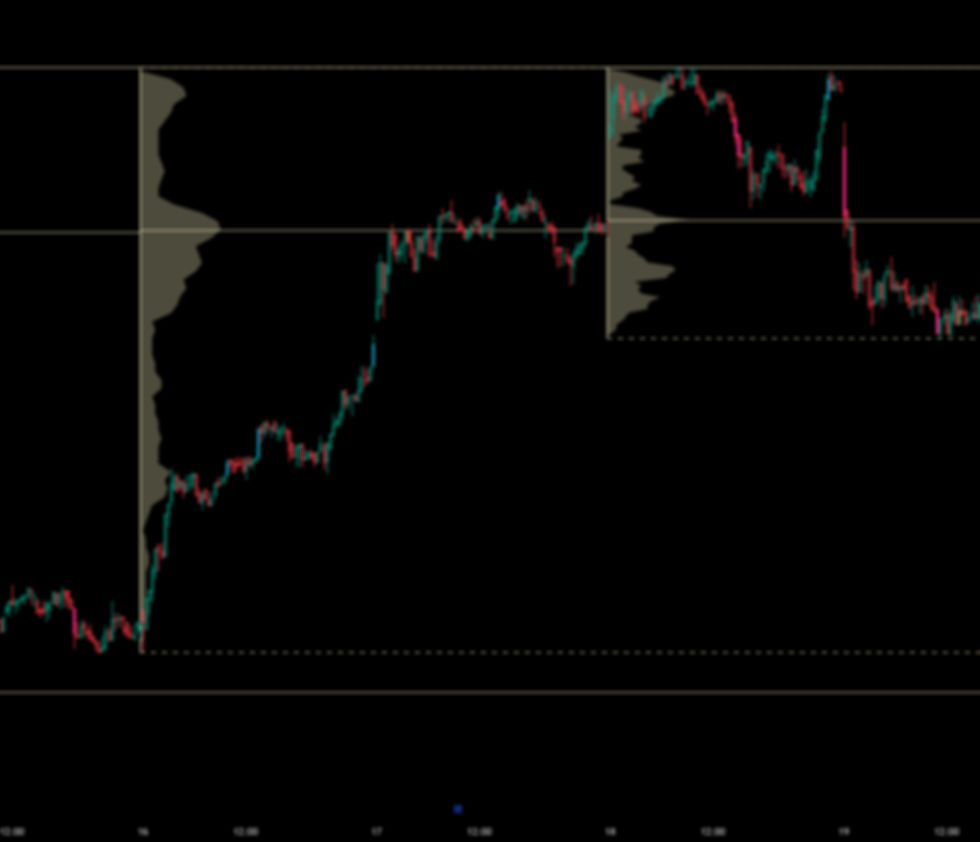
Smart Candle Colour Logic: Our proprietary candle-coloring logic highlights institutional activity in real time, giving traders instant clarity on market moves.
-
Blue Candle – Strong institutional buying activity
-
Pink Candle – Powerful institutional selling activity
-
Yellow Candle – A potential reversal signal, often known as the “Operator Candle”, especially when price is trading above its value area


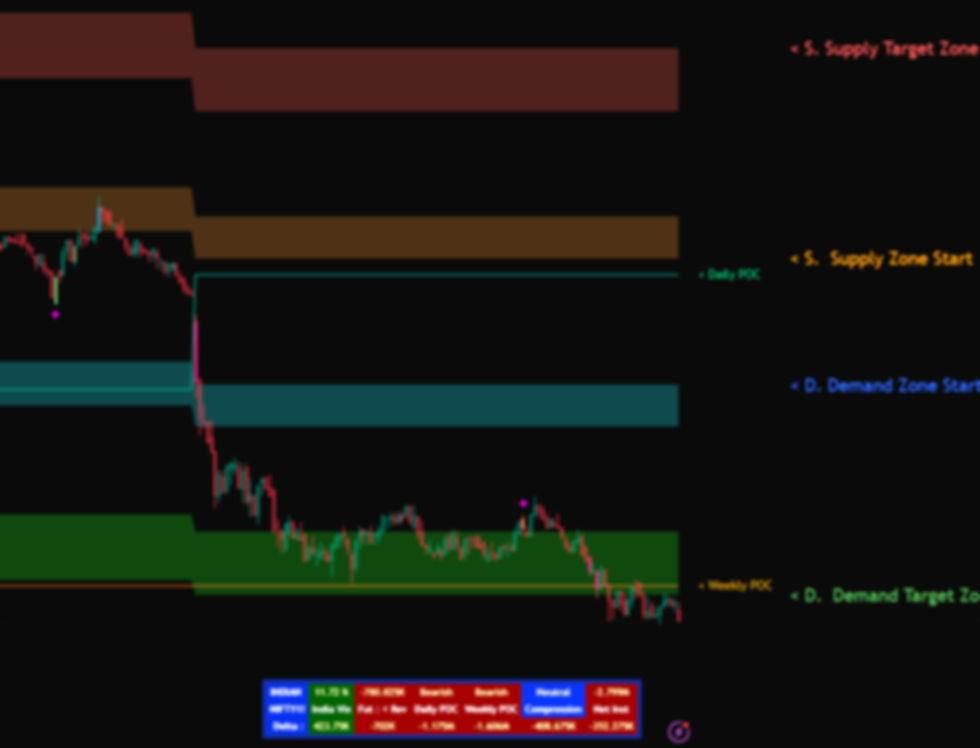
Lets find Automated Supply & Demand Zones
Automated Supply & Demand Zones : Identify market turning points with precision using our automatically plotted Supply and Demand Zones. These zones highlight areas of strong institutional buying (Demand) and institutional selling (Supply).
-
Supply Zone 2 (Red): ~90% chance of sell opportunity or reversal
-
Supply Zone 1 (Light Orange): ~60% chance of sell opportunity
-
Demand Zone 1 (Light Blue): ~60% chance of buy opportunity
-
Demand Zone 2 (Green): ~90% chance of buy opportunity

Understanding the Impact of Order Blocks with Volume

Supply Order Block
Demand Order Block
Magical Trade Order Block : Uncover the hidden footprints of institutions with our Magical Trade Order Block tool. It automatically identifies and plots unfilled order blocks in real time, allowing traders to separate genuine breakouts from fake ones.
Trend Table

Market Type : Indian
Script Name : Nifty1!
India VIX : 11.72 %
Future OI Data : - 773.1 K (Outgoing Money)
Daily POC (Trend) : Bearish
Weekly POC (Trend) : Bearish
Today, Compression : Neutral (No Compression)
Net Institutional
Delta Volume (Buy-Sell) : -2.799
Delta Volume 5-Day Cumulative : 426.45K
3-Day Cumulative : -699.3K
2-Day Cumulative : -1.173M
Today Cumulative : -1.603M
Half Day Cumulative : -408.67K
Quarter Day Cumulative : -352.27K